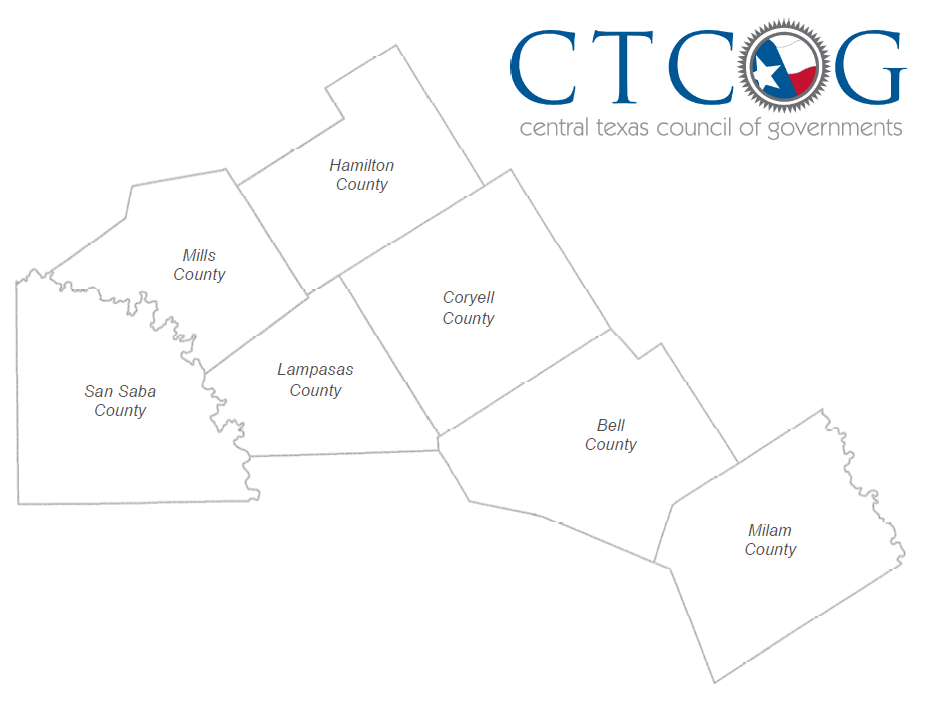
The counties of Bell, Coryell, Hamilton, Lampasas, Milam, Mills, and San Saba comprise the Development District of Central Texas (DDCT). The DDCT serves the Central Texas Council of Governments (CTCOG) seven-county planning area providing economic development assistance to approximately 476,360 persons within a 6,559-square mile area. The DDCT was incorporated in the State of Texas as a non-profit corporation on June 24, 2002. A Board of Directors originally composed of 27 representatives from local governments, chambers of commerce, business, economic development organizations, and minority interests began this corporation. The Board of Directors acts as the Comprehensive Economic Development Strategy (CEDS) Committee for the District. [1] The Economic Development Administration requires that each Economic Development District produce a CEDS every five years. This ensures that each district maintains an up-to-date strategy to establish economic goals, address challenges facing their respective region, and guide development priorities. The CEDS process drives districts to examine the region they serve, innovate new ways of supporting development in that region, and stipulate specific metrics for measuring success. Hence, the CEDS process, not just the final strategy document, is critical for districts. The CTCOG provides the administrative and operational support for the DDCT. Initiated in 1967, the CTCOG has been consistently involved in program administration and development. Taking an aggressive and progressive approach to providing needed services to its members, the CTCOG has been an active member in the development of planning organizations.
Background Summary
Population Growth
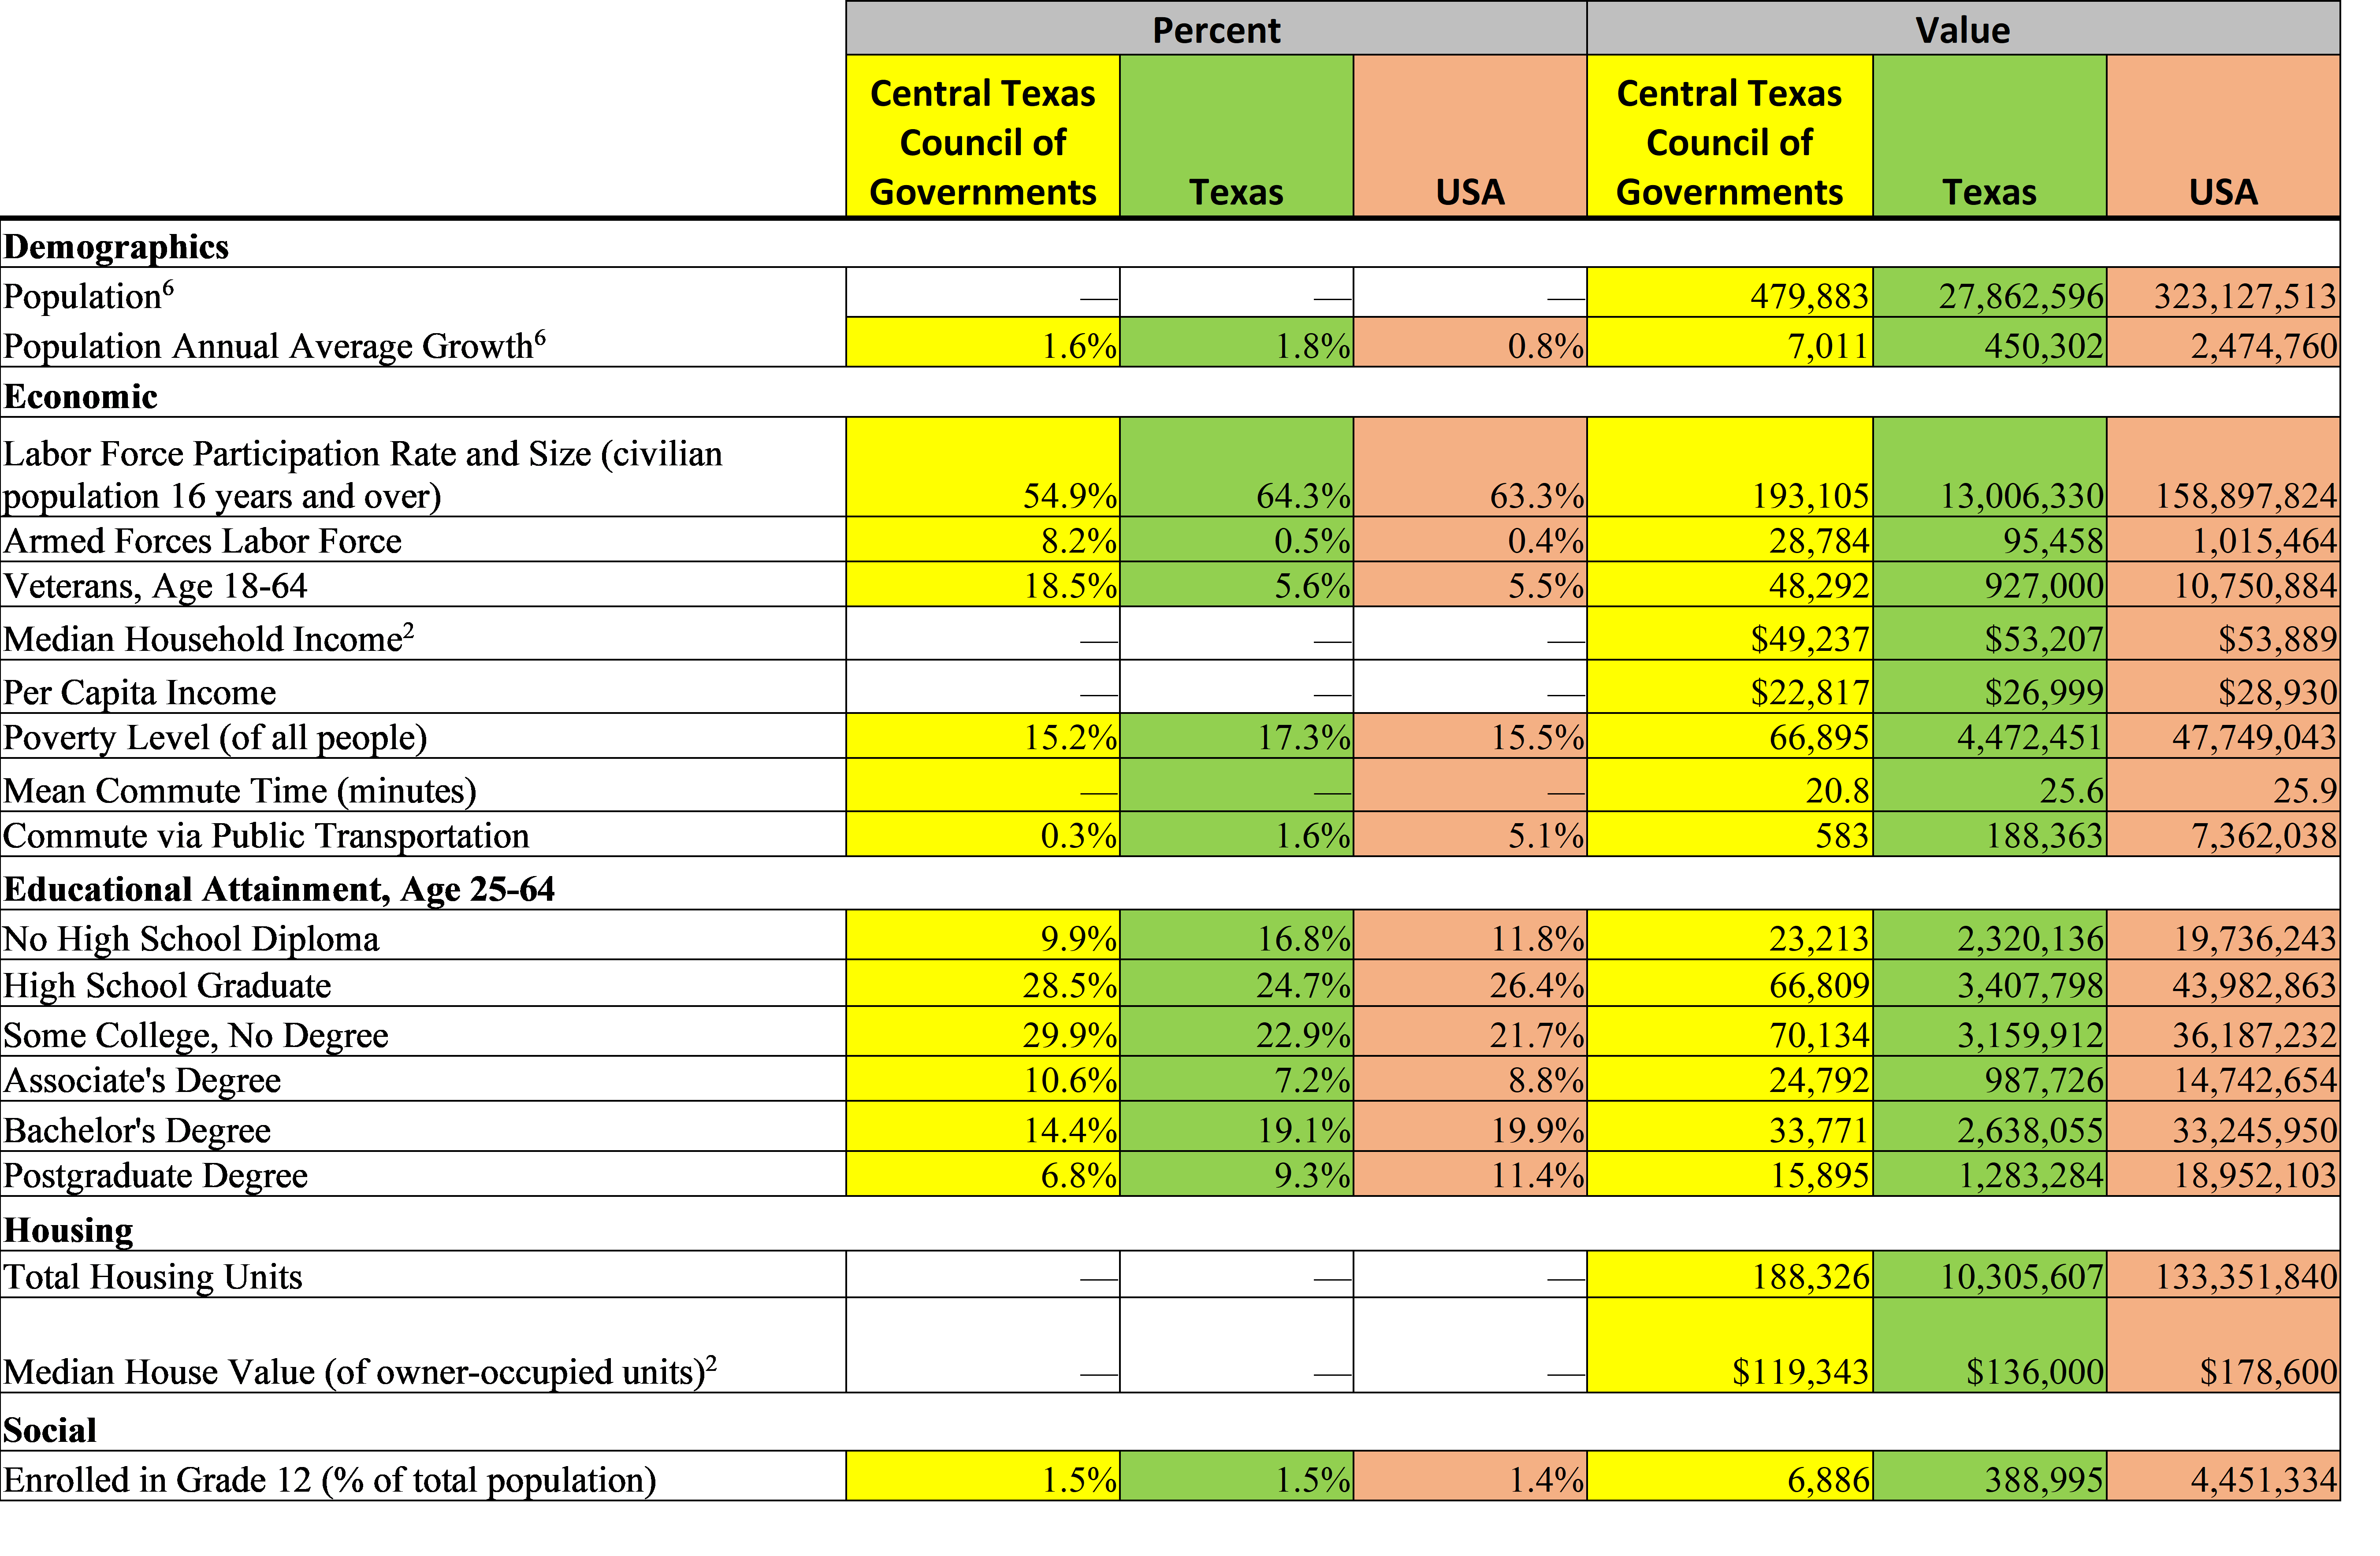
The Texas Demographic Center reported a huge growth projection for Central Texas. The 7-county region has experienced significant population growth in Bell, Coryell, and Lampasas Counties in recent years, adding approximately 26,719 people to the Central Texas COG region between 2010 and 2016, from 449,641 to 476,360. Population projections for 2017 through 2045 show that the region will likely increase in population by approximately 229,755 by the end of year 2045, and population at that time could be over 700,000. [6] The Central Texas Workforce Strategic Plan reported that “the Central Texas area has a population density of 68.08 residents per square mile compared to a statewide density of 95.92; it has one urban county with a population density of 285.14 residents per square mile and six rural counties with a combined population density of 25.27 residents per square mile”.
Exhibit 2: Regional Population Growth
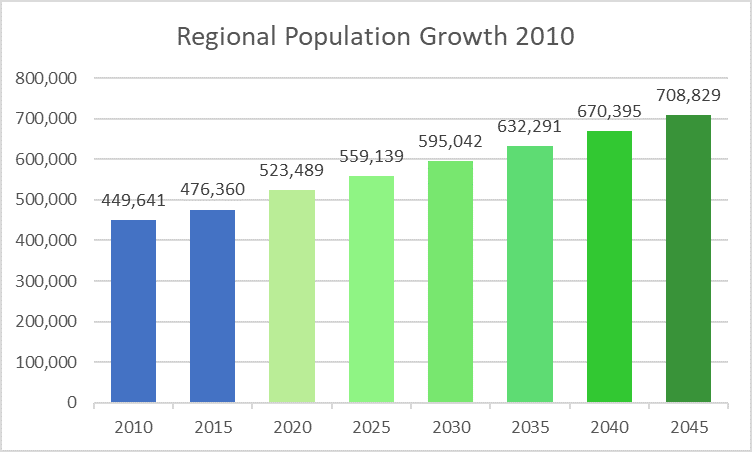
Source: Texas Demographic Center
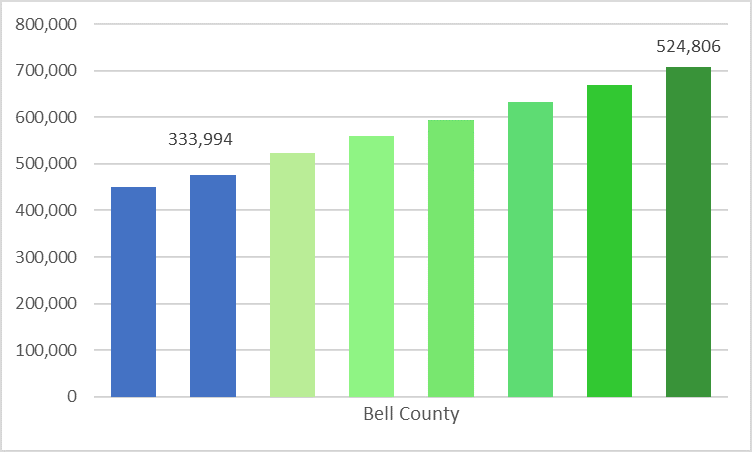
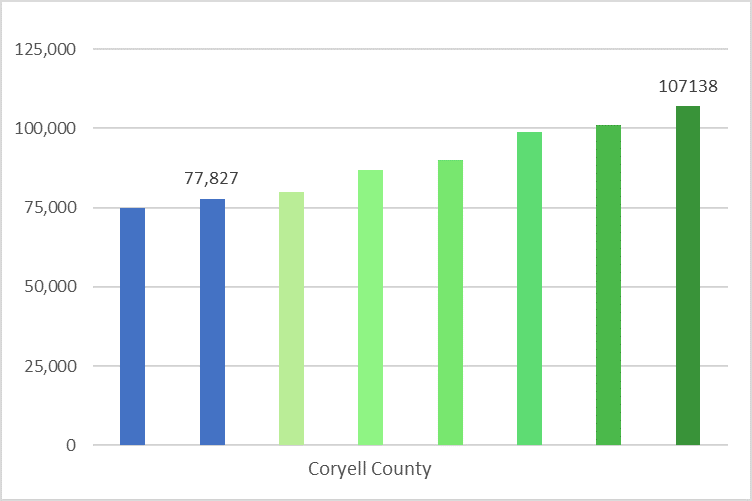
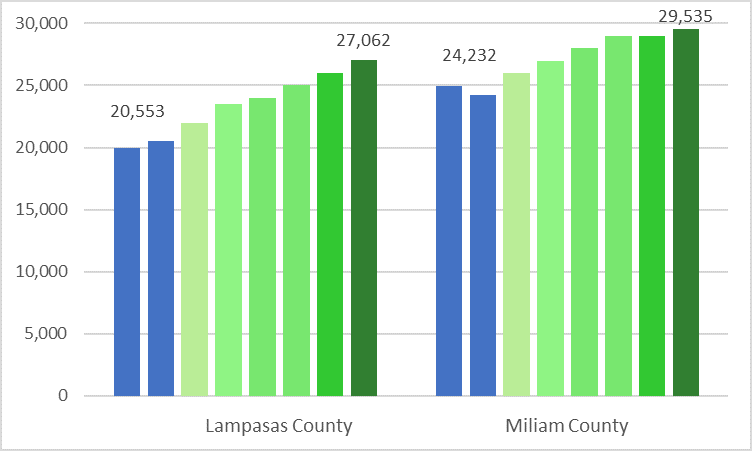
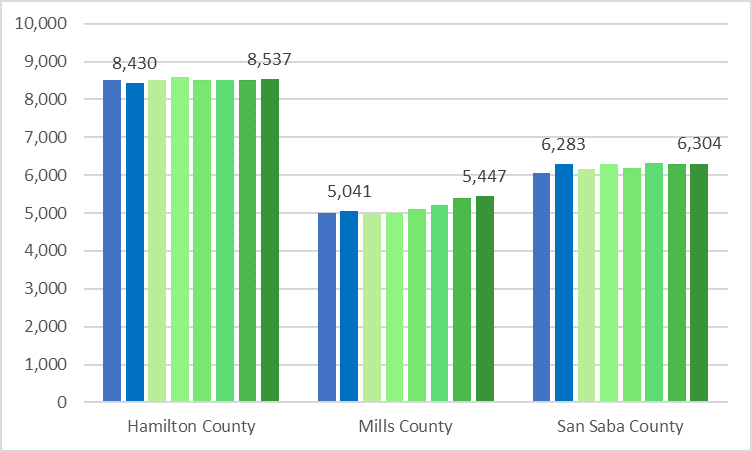
The fastest growing county in the CTCOG region is Bell County, with a population at the end of 2016 over 336,000 and at the end of 2045, it is projected to reach almost 525,000. In Exhibit 3 the graphs show growth in four out of seven most populous CTCOG counties, noting that the region’s general population is growing region in the State of Texas. [6]Regional population growth has been consistent but below state averages with 21,910 net new residents entering the area at a pace of just under 1 percent per year between 2010 and 2015. The bulk of that growth has been in Bell county (57%), Coryell County (37%), Lampasas county (31%) and Milam County (21%). Three counties do not have significant growth going forward: Hamilton 1%, Mills 8%, and San Saba .03%. [1]
EXHIBIT 3: Population of CTCOG Region. Estimates are shown for 2014 and 2015, and Projections are shown for years 2016 – 2045


Jobs and Employment
The Central Texas regional economy had approximately 199,642 jobs in 2016 and grew at roughly six percent between 2013-2016, adding 12,067 new jobs, as reported by the Central Texas Workforce publication: On the Move, Part 1. As the largest single economic driver of the Central Texas economy, Fort Hood supports 66,492 people on-post, including 21,221 civilian employees and contractors. According to a July 2016 release by the Texas Comptroller’s Office, Fort Hood is responsible for $35.4 billion in Texas statewide economic activity and over 200,000 total jobs – a majority of which fall in Central Texas. Although these latest figures show a decline in jobs and economic impact from 2011 estimates, they are substantial none-the-less. As the largest Reserve training center in the Army, Fort Hood is estimated to economically touch 1 in 4 residents of Bell and Coryell counties in some manner. All manner of “population support industries” from areas from local school districts, to housing, retail trade, and leisure and hospitality owe some measure of activity from Fort Hood. Even with moderate population growth, the housing industry has continued to be strong in the Central Texas region with the Heavy and Special Trade Construction sector adding 2,203 jobs between 2013 and 2016. [1]. Job tenure data does not show significant trends in job hopping behavior. However, there is a growing body of anecdotal evidence that younger workers are choosing to change jobs to achieve several career building objectives. With fewer defined pension plans, and portable healthcare through the Affordable Care Act., workers have fewer financial incentives to stay at the same job. Slower wage growth and smaller cost of living adjustments resulting from low inflation, means that many workers are relying on job movement to increase earnings. Job change also tends to lead to expanding one’s network of contacts, creating greater opportunities for the future, and learning new skills while gaining knowledge and experience in different environments and cultures. The labor market is increasingly difficult to navigate, even for those with resources. For those without education, financial means and workplace knowledge, building a career can seem impossible. The business community is also taking notice and many companies, fearful of labor and skill shortages due to retiring baby boomers, are rethinking how they attract younger workers, grow their potential, and organize work. [2]
The labor force participation rate (LFPR) is a ratio — the population that is employed or actively searching for work as a share of the total civilian, non-institutional population aged 16 and older. Exhibit 4 graphs the labor force participation, as percentages by county per the 2015 American Community Survey (ACS) which is an ongoing survey that provides vital information on a yearly basis.
Exhibit 4: Labor Force Participation Rate By Age
 Source: 2015 ACS
During 2016, the Texas Total Nonfarm Employment added 218,800 jobs, which was a 1.8 percent annual growth rate, with eight of 11 industries showing growth. Education & Health Services showed the highest annual gain of 54,500 jobs, also the highest annual growth rate of 3.4%. Leisure & Hospitalities gained 41,000 jobs. Mining & Logging reported the largest annual loss of 14,200 jobs. In comparison, the Central Texas Region shows in Exhibit 5 that Education and Health Services had the highest number of employment, with 49,303 jobs, followed by Trade, Transportation and Utilities which had 30,986 employment.
Exhibit 5: Share of Employment by Industry, 2016
CTCOG Region
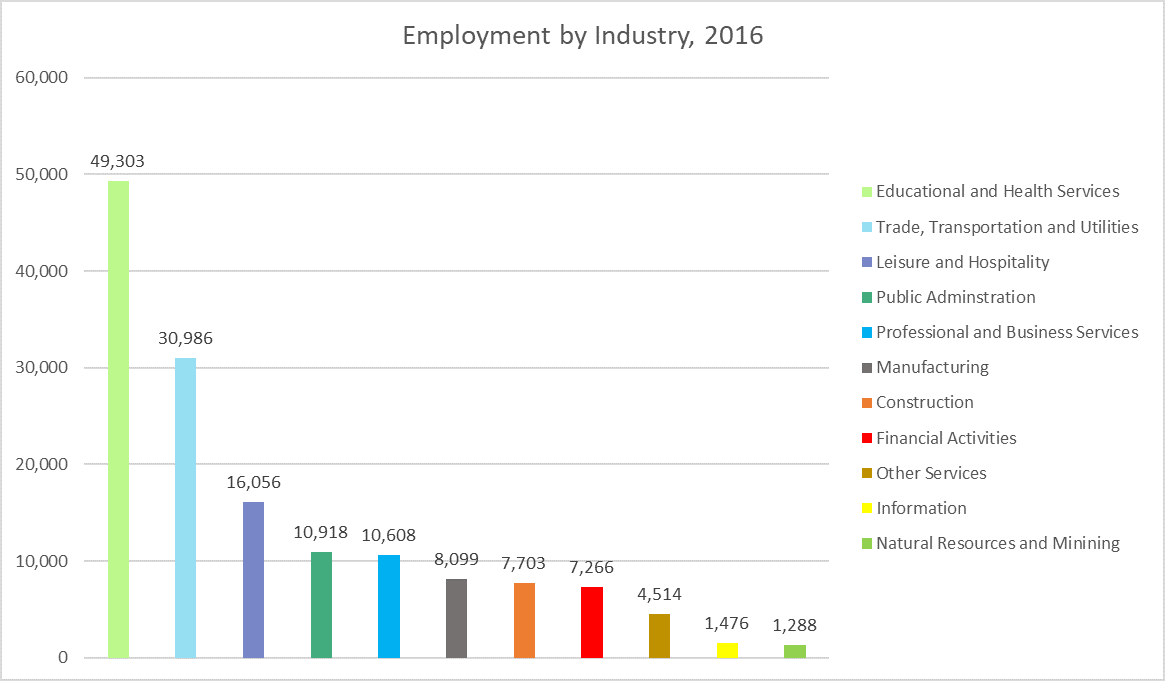
Source: Texas Workforce Commission
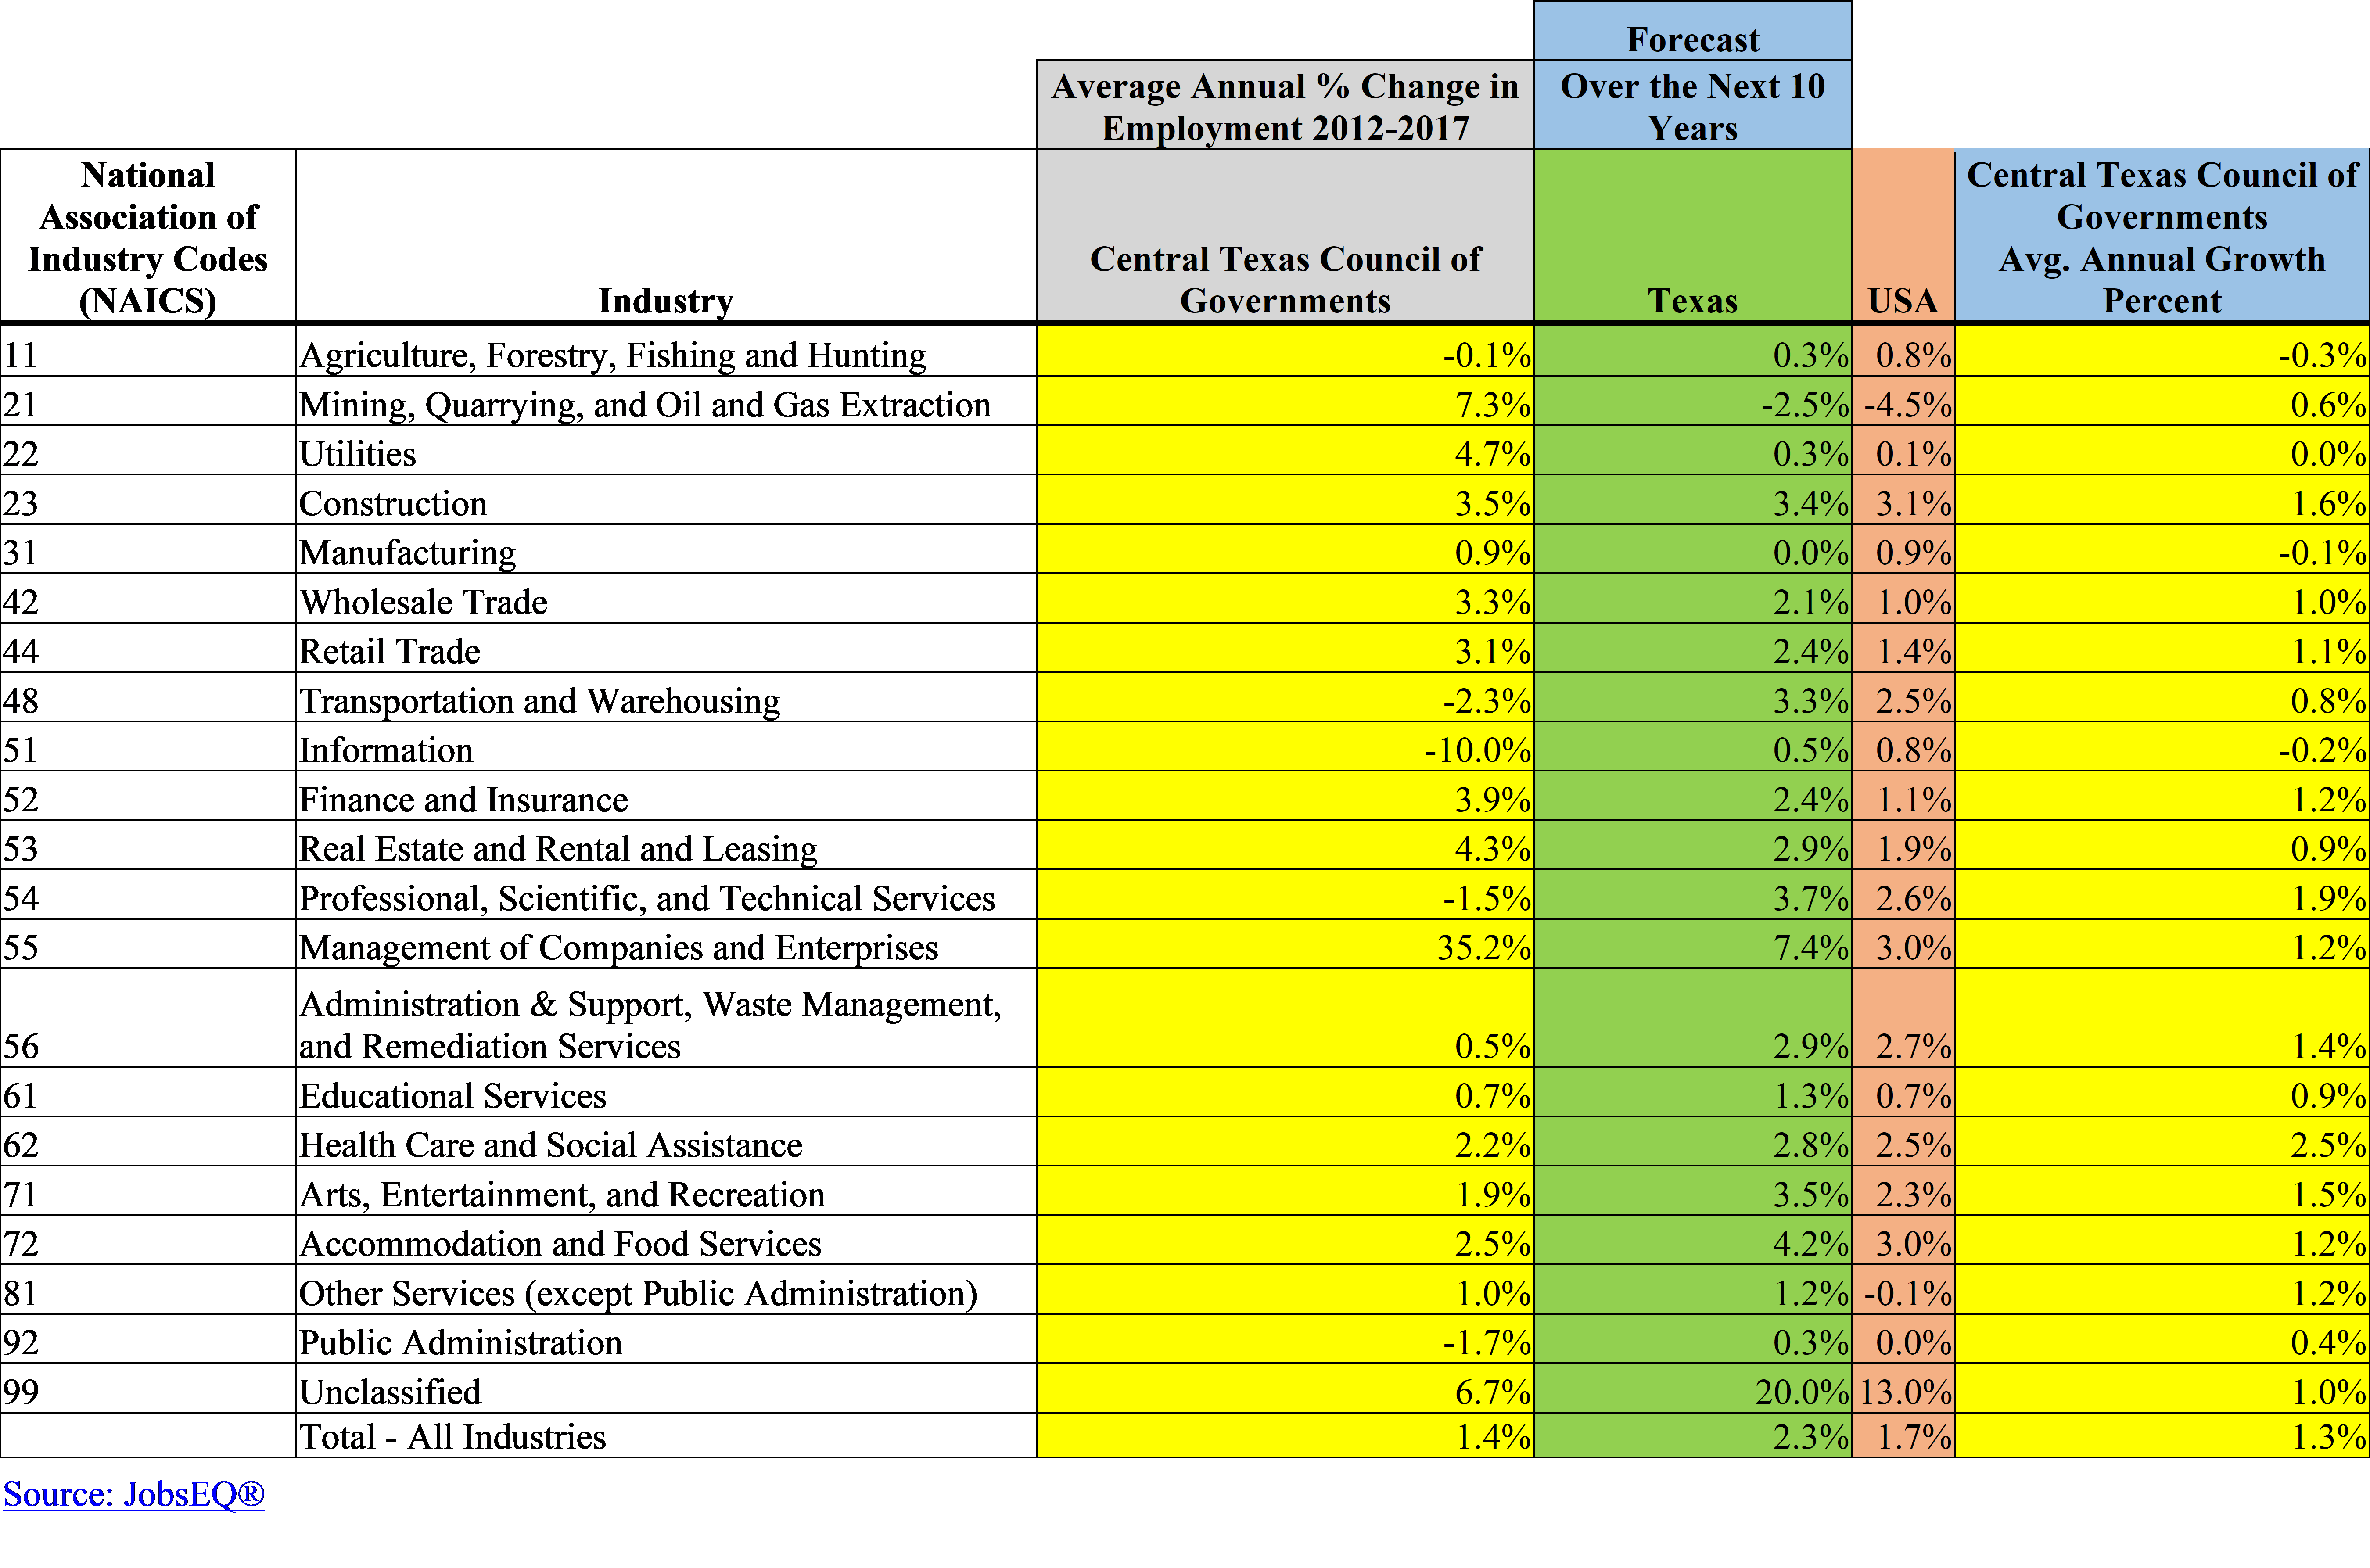
By the year 2024, employment in Central Texas Public Administration industry is projected to surge to approximately 21,210,
surpassing Leisure and Hospitality industry. Steady growth is expected in all other areas of employment, as shown in Exhibit 6.
Exhibit 6: Share of Employment by Industry
CTCOG Region
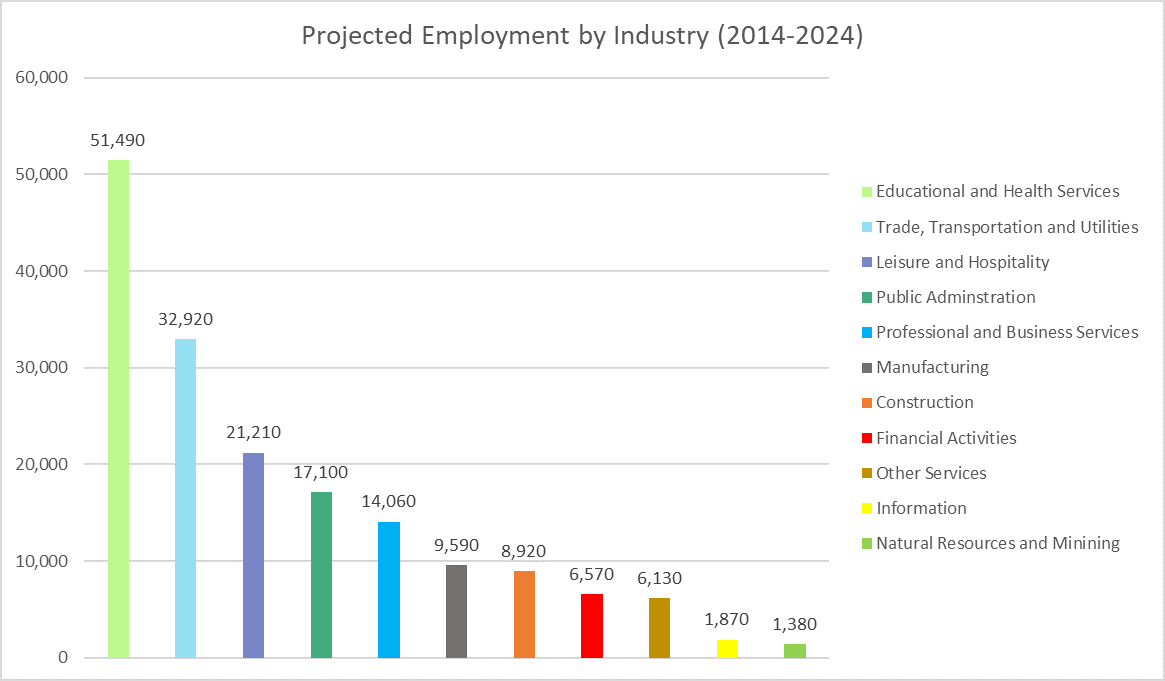
Source: Texas Workforce Commission
Occupations were ranked by analyzing three factors: number employed, five-year growth, and average annual wages. The top 20 occupations, as ranked, are shown in Exhibit 7. Note that not all industries are represented as this is a snapshot of the most numerous, growing, and well-paid occupations from a list of 460 SOC job fields, grouped by industry, across the Killeen-Temple MSA. See the Bureau of Labor Statistics for a complete explanation of the Standardized Occupation Codes (SOC). [4]
Exhibit 7: Top Ranked Occupations , from 2011 Quarter 4 to 2016 Quarter 4
CTCOG Region
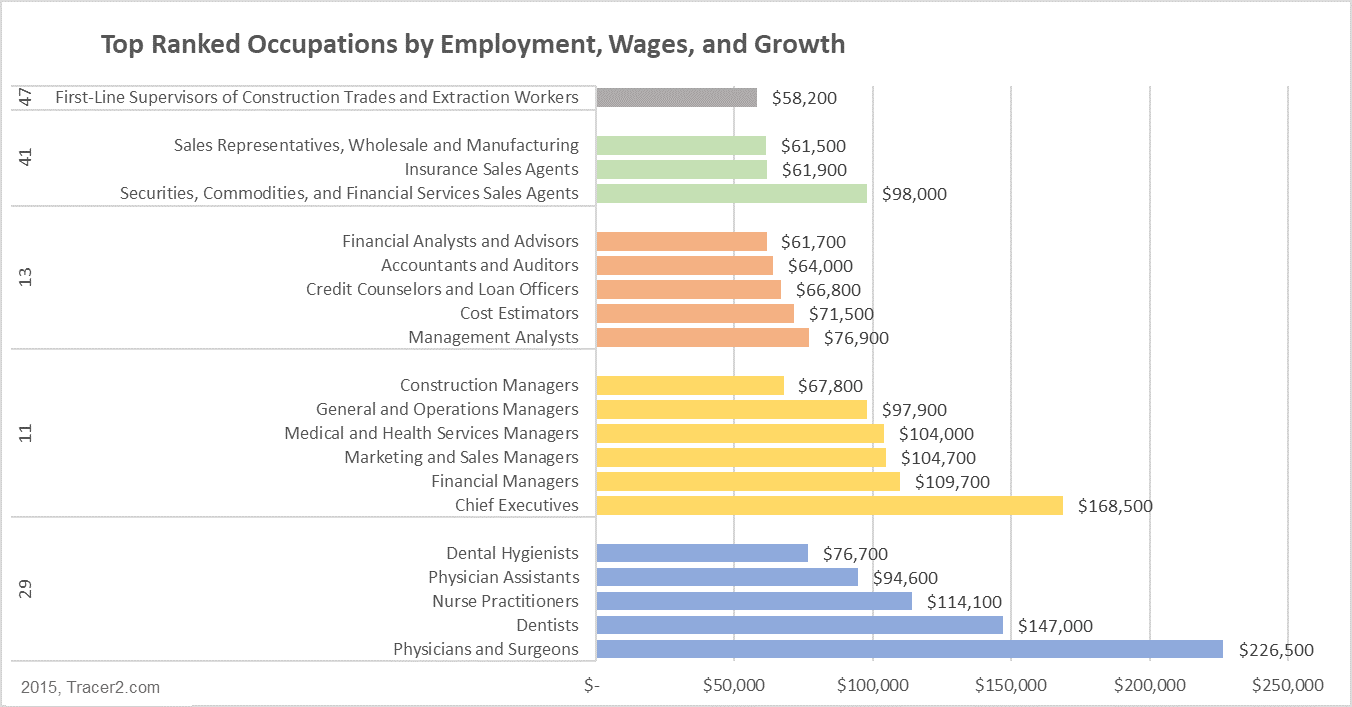
Exhibit 7: Top Ranked Occupations
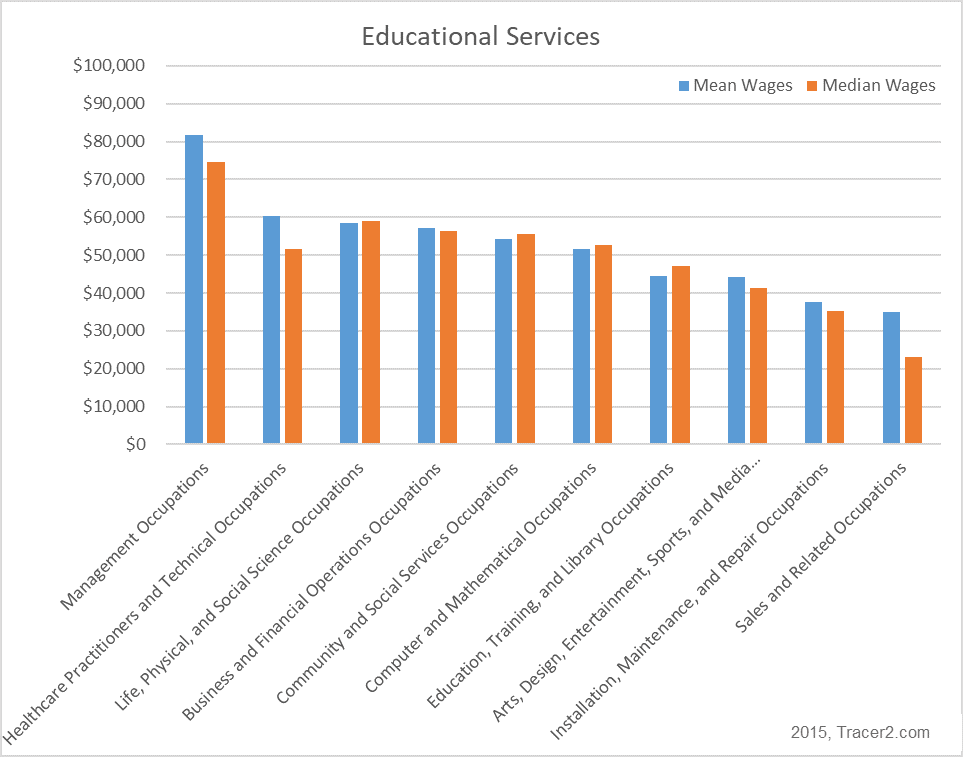
The following wage information on Exhibits 8.1 – 8.6 were compiled by industry sector to show the differences in each individual job in the titled industry sector.
Exhibit 8.1: Regional Median and Mean Wages by Industry Sector
2015, Tracer2.com
CTCOG Region
CTCOG Region
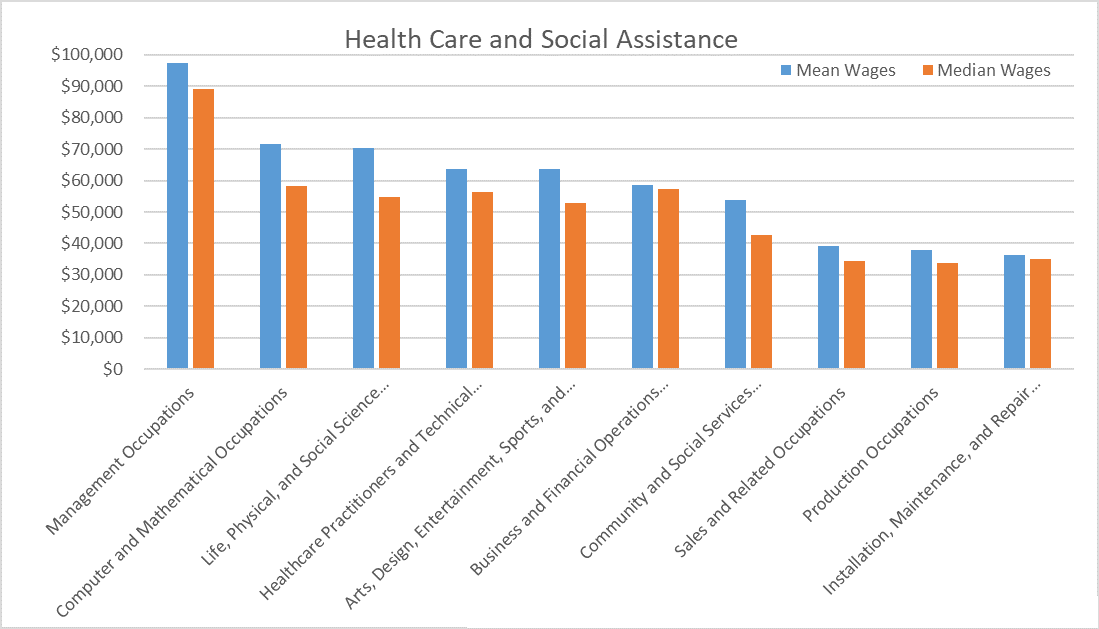
Exhibit 8.2: Regional Median and Mean Wages by Industry Sector, 2015 Tracer2.com
CTCOG Region
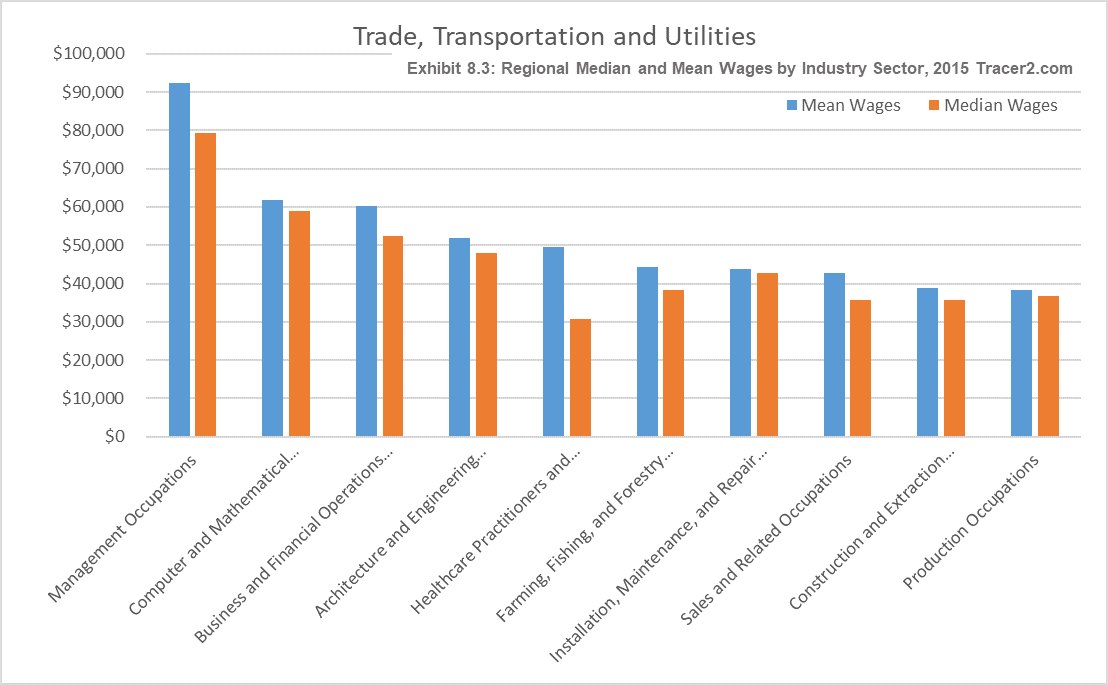
CTCOG Region
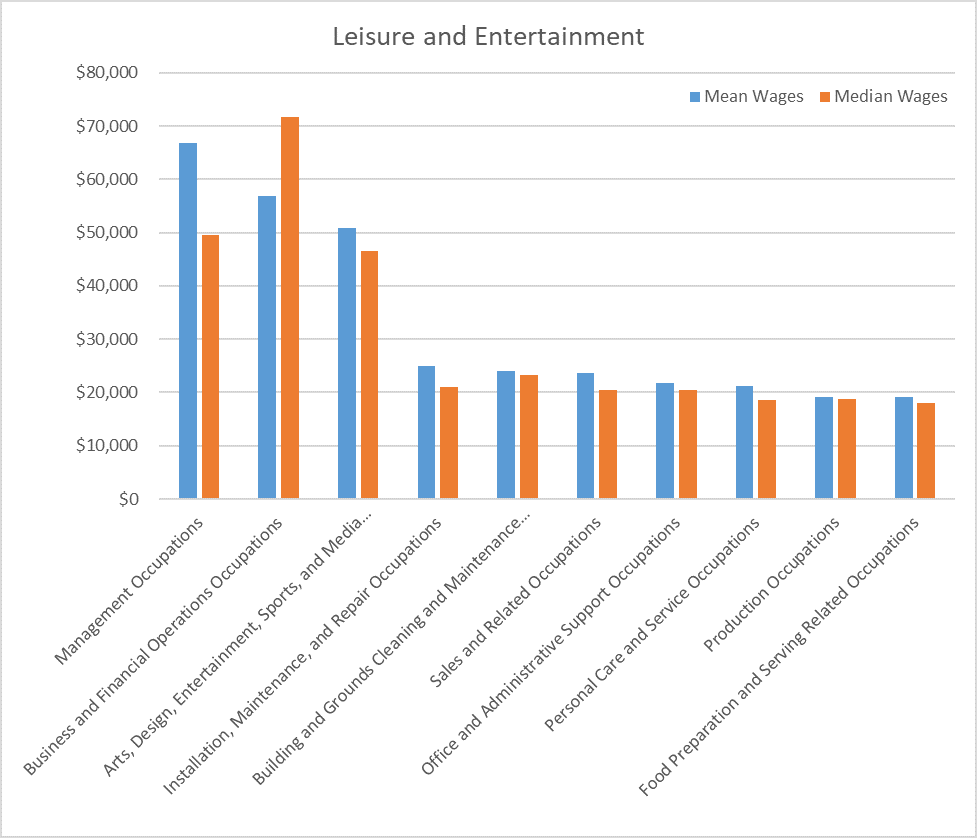
Exhibit 8.4: Regional Median and Mean Wages by Industry Sector, 2015 Tracer2.com
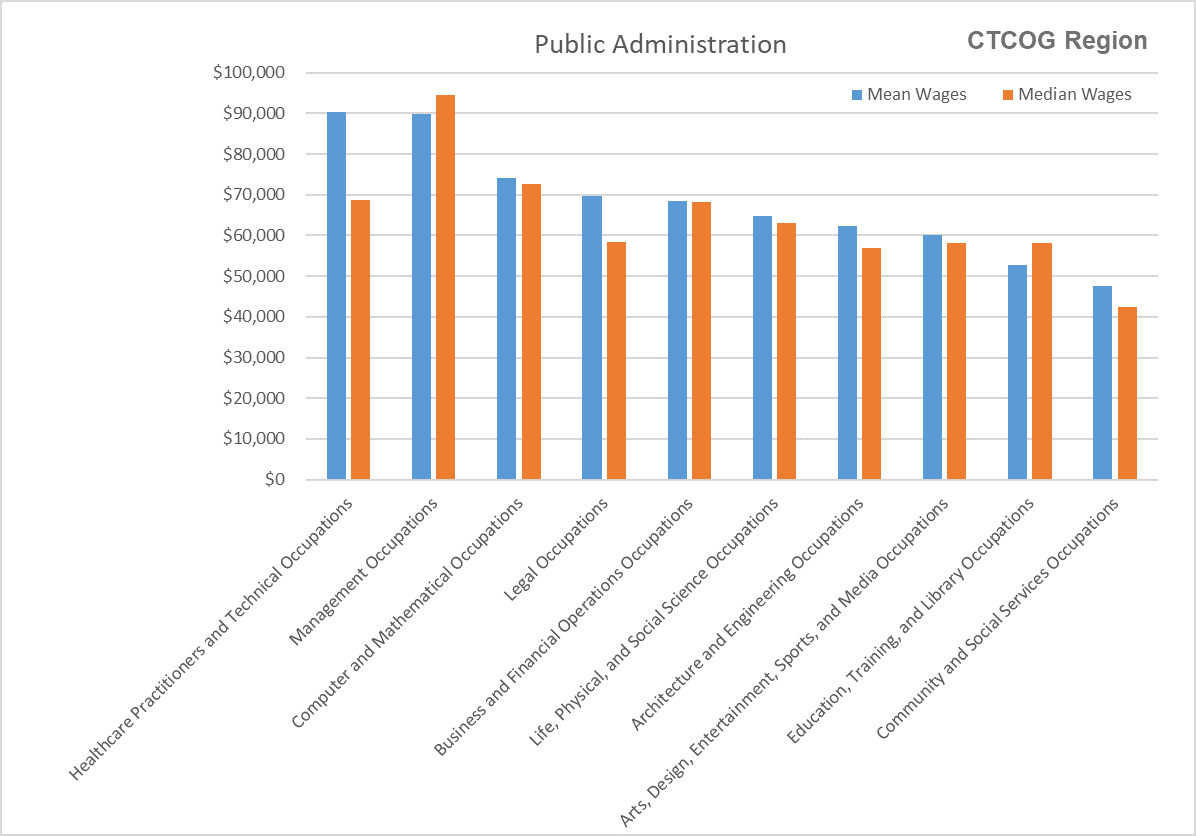
Exhibit 8.5: Regional Median and Mean Wages by Industry Sector, 2015 Tracer2.com
CTCOG Region
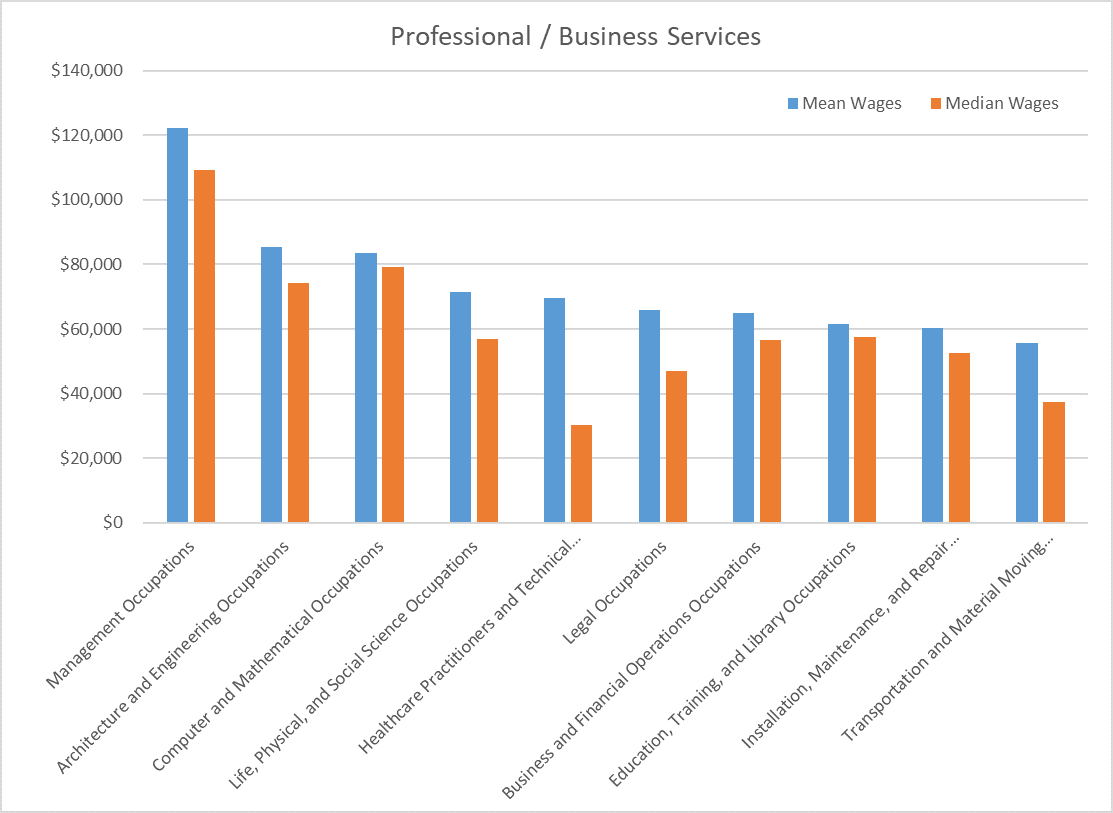
Exhibit 8.6: Regional Median and Mean Wages by Industry Sector, 2015 Tracer2.com
Education and Workforce
The housing industry in the Central Texas region has continued to surge with the Heavy and Special Trade Construction sector adding 2,203 jobs between 2013 and 2016. The region is home to four higher education institutions; Central Texas College, Temple College, the University of Mary Hardin Baylor, and the newly established Texas A&M -Central Texas.[1]
Exhibit 9: Regional Educational
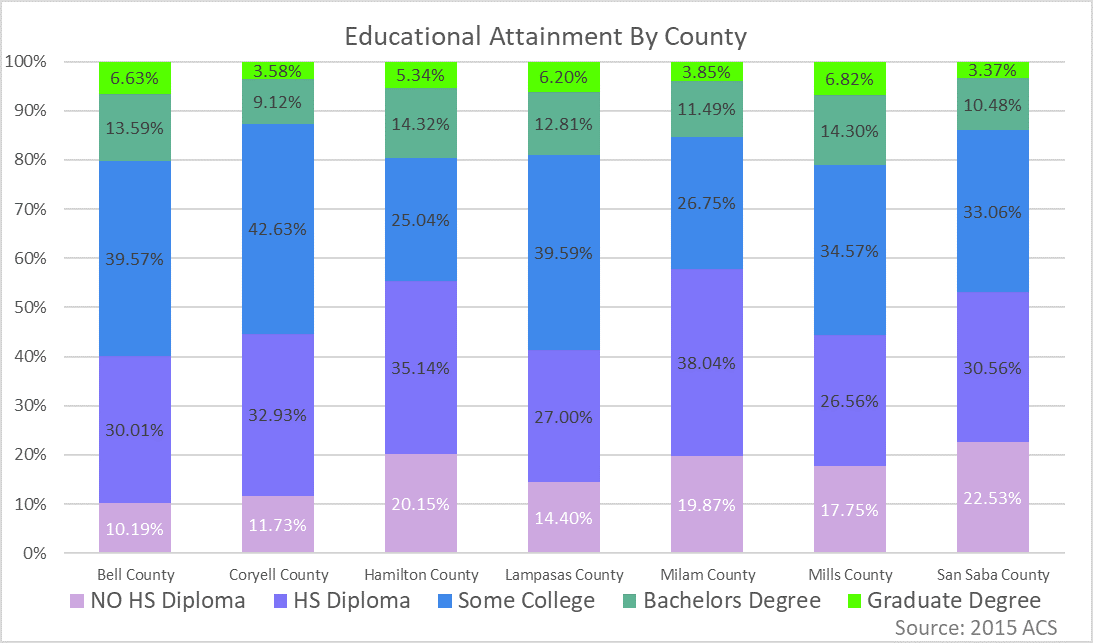
REGIONAL EDUCATIONAL ATTAINMENT
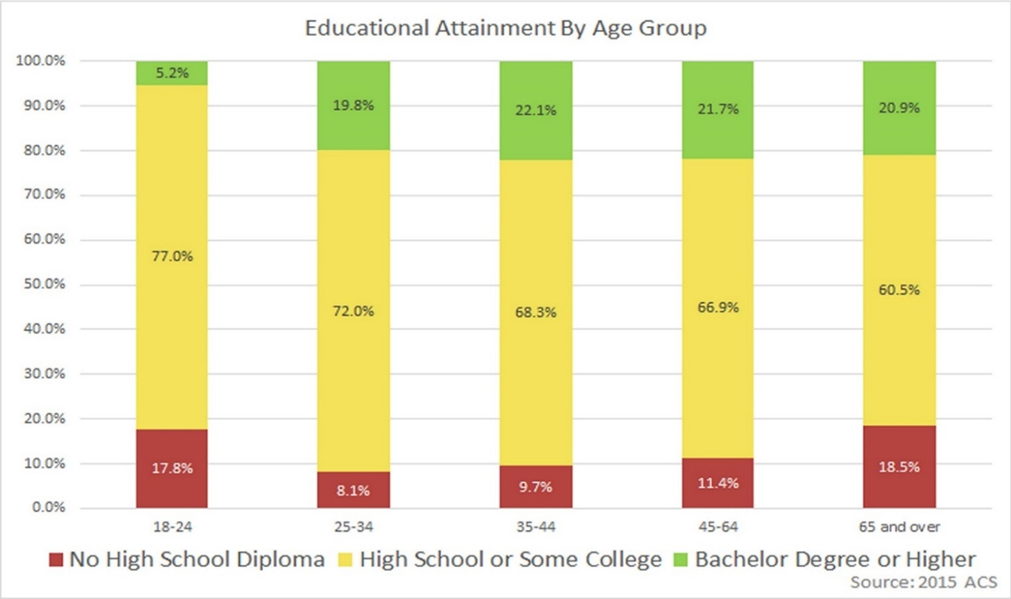
Twenty percent of the Central Texas Region, ages 25 and up, have a Bachelor’s Degree or higher. This indicates that education is a high priority, but room to improve is evident. In the 18-24 age group, 17.8% do not have high school diplomas. This may indicate a priority for the region to address, in terms of future growth and education.
Exhibit 10: Educational Attainment by Age
CTCOG Region
Housing and Transportation
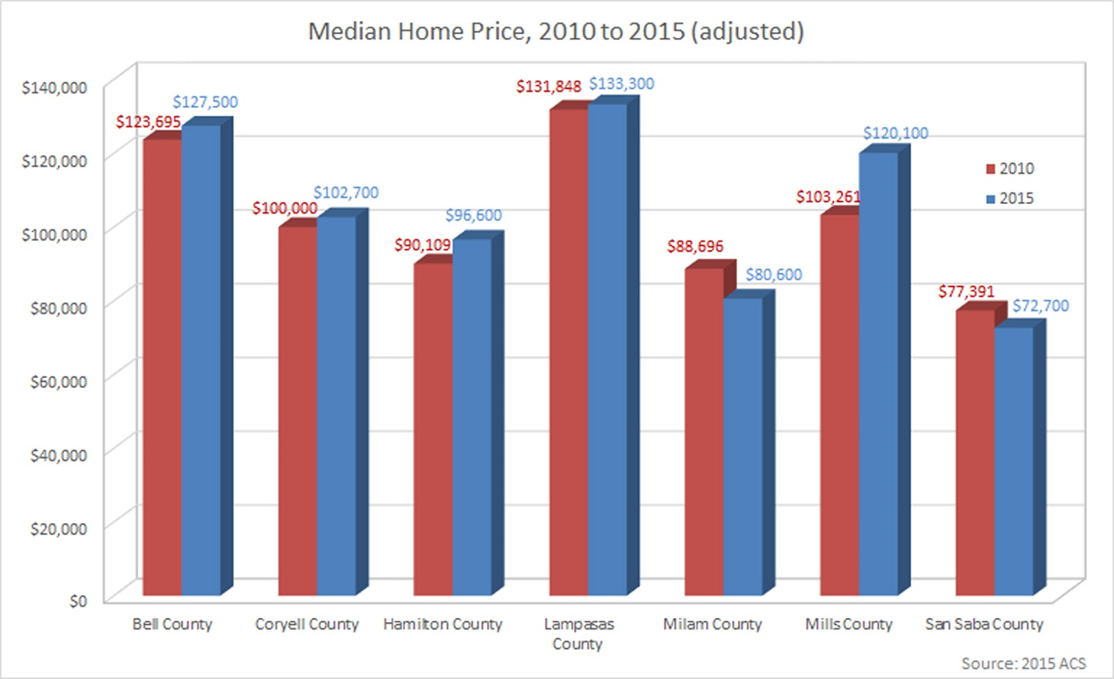
The seven counties in the CTCOG region had rising median home prices during 2010 to 2015, ranging from a 1% increase in Lampasas County to a 16.5% increase for Mills County. The two smaller counties (Milam and SanSaba) median home prices dropped 6.5%-10%.
Exhibit 12: Median Home Price
CTCOG Region
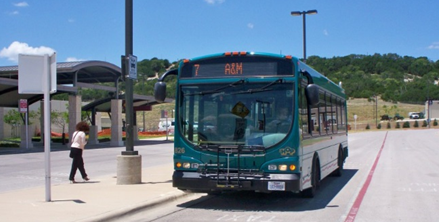
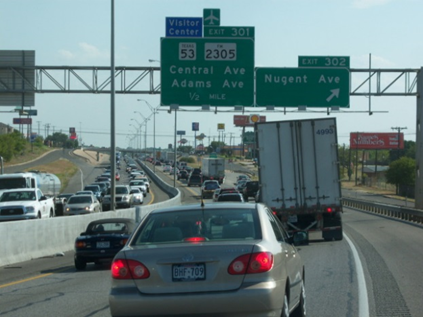
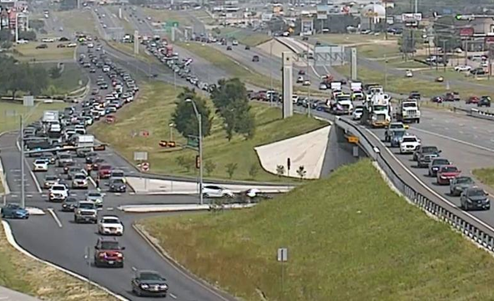
Central Texas Commute Patterns
Recognizing that residents may work in one community but live, pay taxes, and spend most of their income where they live, draws attention to the importance of exploring commuting patterns. Using “residence adjustment” as a means to assess the degree to which the Central Texas regional area serves as a bedroom community, the change from $244,911 in 2010 to $194,153 in 2011 indicates that the Workforce Area experienced substantial loss of local income. A negative number implies that Central Texas workers commute into the region to earn income but do not reside here. Growth over time of negative residence adjustments generally implies an eroding tax base for the region. Similarly, a positive figure implies that on balance the region exports jobs and income to residents of other regions. [8]


Water and Air
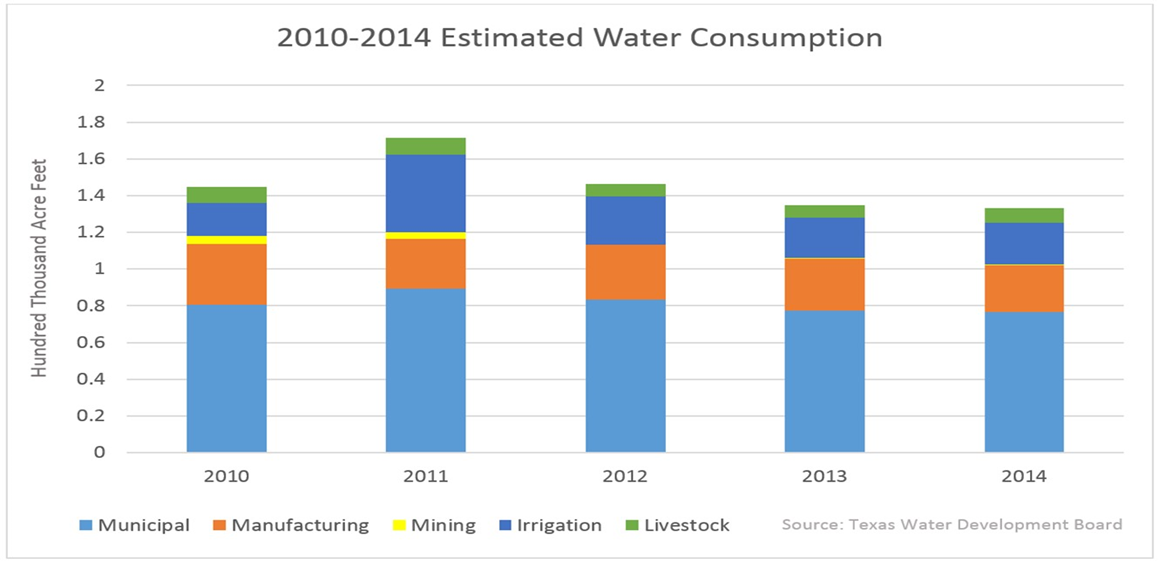
The graph represents the total estimated water consumption by use in Bell, Coryell, Hamilton, Lampasas, Milam, Mills and San Saba counties from 2010 through 2014. These uses include municipal, manufacturing, mining, irrigation and livestock. From 2010 through 2014, municipalities used the most water during this five year period, followed by manufacturing, irrigation, livestock and mining. 2011 saw the highest amount of water being used with an estimated total of 153,000 acre-ft. which equals approximately 50 billion gallons of water. From 2012 to 2014, the amount of water being consumed decrease each year with 2014 being the lowest at an estimated total of 133,000 acre-ft which equals approximately 43 billion gallons of water. Estimated water consumption data was collected through the Texas Water Development Board.
Water Consumption
Exhibit 13: Water Consumption Trends
CTCOG Region
Air Quality
The graph in Exhibit 14 represents the 4th highest eight-hour ozone value from 2010 to 2016 at two ozone monitoring stations in Bell County. Stations are located at Killeen Skylark Field and the other one at West Temple Park near Georgia Avenue. The EPA requires Bell County to measure ozone values to remain in compliance with the National Ambient Air Quality Standard (NAAQS) of 70 parts per billion. The EPA uses the Design Value, which is a 3-year average of the 4th highest 8-hr ozone average, to determine if Bell County remains in compliance to the NAAQS standard. To determine the 8-hr ozone average, each station takes an ozone reading for each hour of the day. The 8-hr average is the average of each eight-hour block period and the highest average is the ozone reading for that day. Data used for this graph was collected by Texas Commission on Environmental Quality.
Exhibit 14: Ozone Trends
CTCOG Region
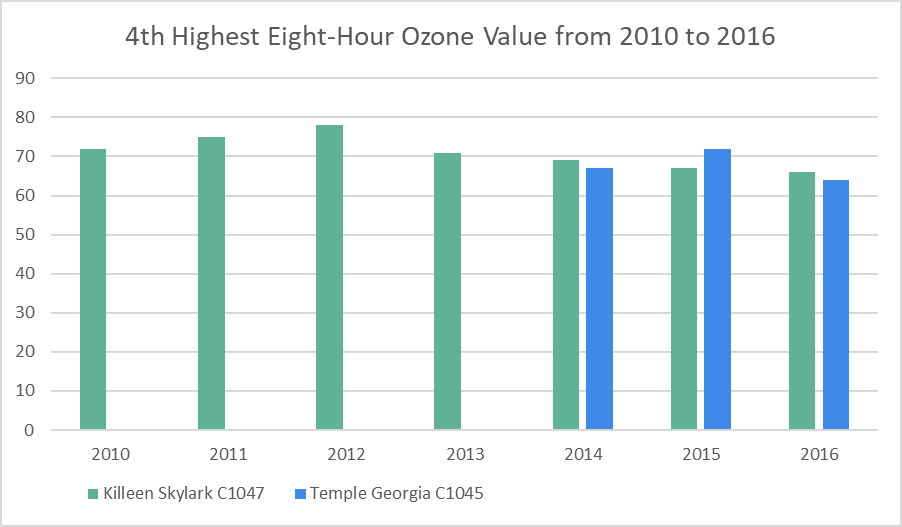
Source: https://www.tceq.texas.gov/cgi-bin/compliance/monops/8hr_4highest.pl
Demographics Summary